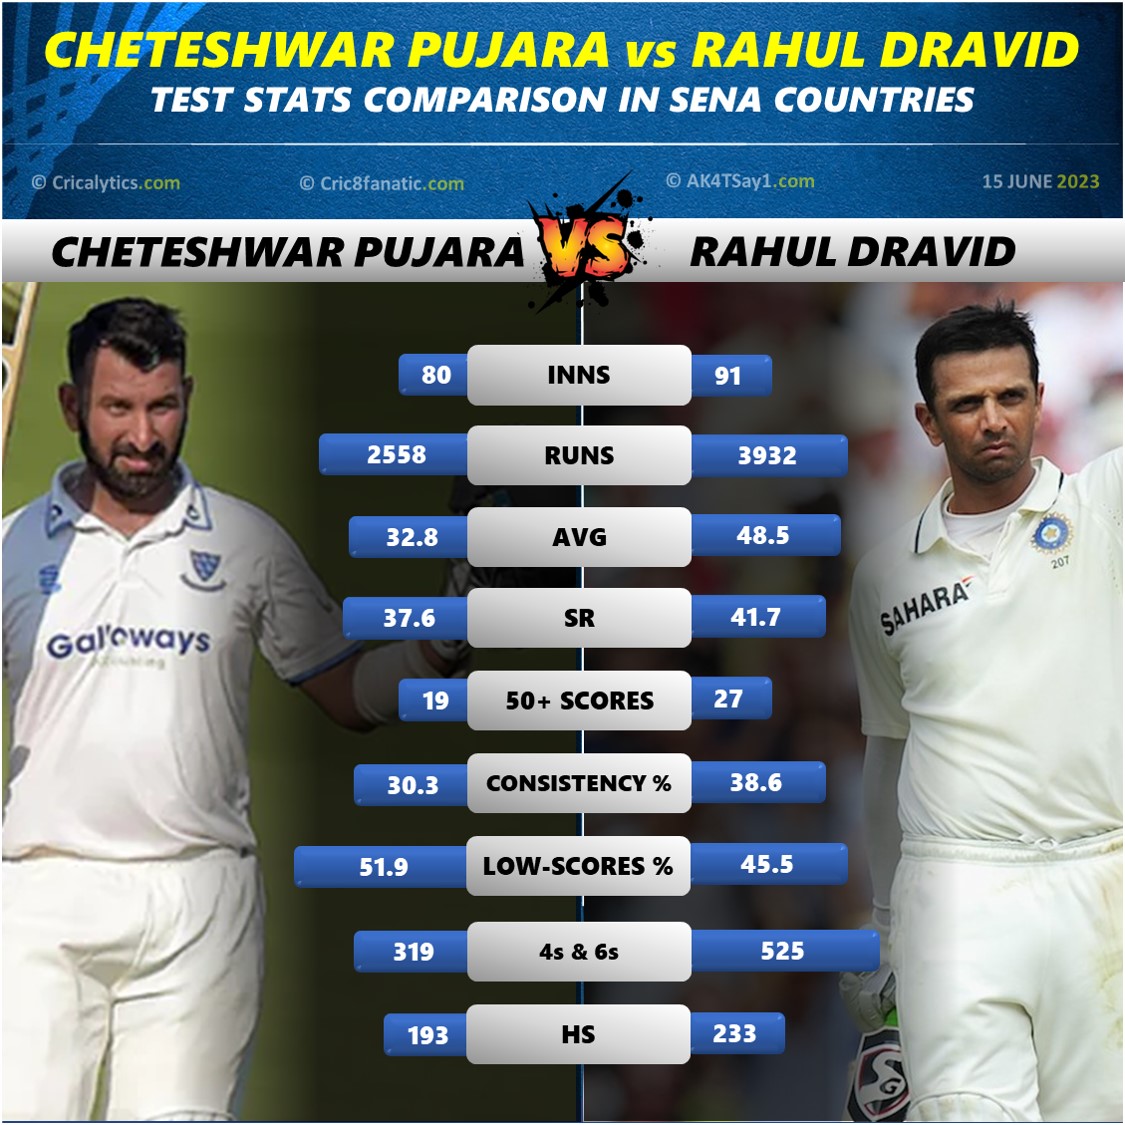
The two walls of Team India go on head-to-head in a unique stats comparison in the Test matches for Cheteshwar Pujara vs Rahul Dravid.
When Rahul Dravid made his Test debut in 1996, little did we know that he would rule the number 3 position in Tests for Team India for close to 16 years. Regarded as the Wall of Team India, Rahul Dravid made that position of his own, and ended his career with a G.O.A.T status in Test cricket.
Towards the flag end of Rahul Dravid’s career, a similar style player with good defence, Cheteshwar Pujara made his Test debut in 2010. Pujara showed a lot of promise early on in his career, and was considered as an ideal heir to Rahul Dravid in Test cricket after his retirement in 2012.
But has Pujara lived up to the expectations? Well, It is 2023, and after another debacle performance in the WTC final by Team India and Cheteshwar Pujara, questions are being raised about his position in Test cricket after an extended dry run in Tests since 2019.
So, in this article, we compare Cheteshwar Pujara vs Rahul Dravid in different scenarios, and see if Pujara has actually lived up to the expectations ever. Of course, comparing these players from different generations won’t be wise. But, here we are only comparing the numbers, and that only showcases if the players have actually been good from that perspective.
#1: In South Africa
What better way that analyze the performance of a player in SENA countries with South Africa to begin? Well, South Africa is a place where both, Pujara and Dravid have an ordinary record. Pujara has scored 535 runs from 19 innings at a bad average of 28. Pujara does have century in South Africa, but that was a decade back in 2013. Overall, Pujara has a consistency of 21%, and his low-scores stand at 57.9%.
Meanwhile, Rahul Dravid hasn’t been good either in Tests in South Africa. He has scored 624 runs from 22 innings at an average of 29.7. Dravid also has a century in South Africa, but that was during his early days in 1997. Overall, Dravid’s consistency stands at 27.2% and his low-scores stand at 54.5%.
Result: Pujara ~ Dravid (1-1)
#2: In England
Coming to England, things take a drastic turn here as Pujara continues his ordinary run in England, but Dravid comfortably shatters Pujara here. While Pujara has scored 870 runs from 32 innings at an average of 38.2, Dravid has scored 1376 runs from just 23 innings at an average of 68.8.
Overall, Pujara has only one century in England as compared to Dravid’s six in almost 50% fewer innings. Pujara’s consistency stands at an ordinary 25.8%. Whereas Dravid’s consistency stands at a solid 50%. Similarly, for low-scores, Pujara has a low-scores % of 58 as compared to Dravid’s 34.7.
Result: Pujara < Dravid (1-2)
#3: In New Zealand
Coming to New Zealand, the situation doesn’t change much either as we had seen in England. Pujara continues to underperform with 160 runs in 8 innings at a poor average of 20, and has netted a fifty only once. In comparison, Dravid has a gold record in New Zealand. He has scored 766 runs from just 14 innings at a superb average of 63. He also has 2 centuries and 5 fifties to his name in New Zealand.
Result: Pujara < Dravid (1-3)
#4: In Australia
Coming to Australia, things finally fall in place for Pujara, who gets pitches that has pace and bounce with some dryness as we see in India. Pujara has done well in Australia scoring 993 runs from 21 innings at a good average of 47.3. His consistency stands at 47.6% and his low scores stand at 28.6% – both way better than his SEN stats.
In comparison, Dravid has a relatively poor record in Australia, which is a surprise. Dravid has scored a total of 1166 runs from 32 innings at a decent average of 41.6. He has a consistency of 32.2% and his low-scores stand at 45.2%. Dravid has only one century in Australia as compared to Pujara’s three.
Result: Pujara > Dravid (2-3)
#5: At Home
Comparing the performance at home, Pujara has slightly better stats as compared to Dravid. While Pujara has scored 3839 runs from 80 innings at an average of 52.6, Dravid has scored 5598 runs from 120 innings at an average of 51.4. Pujara’s consistency stands at 48.7% as compared to Dravid’s 42.9. Whereas for low-scored, Pujara has 34.2% and Dravid has 35%.
Result: Pujara > Dravid (3-3)
#6: Against Top-ranked Teams (SENA & Pakistan)
Finally, comparing the performance against top-ranked teams as described above irrespective of where the matches were played, Dravid once again takes a huge lead here with an unmatchable performance. While Pujara has 5601 runs from 146 innings at an average of 40.6, Dravid has 8263 runs from 193 innings at an average of 47.5. Pujara’s consistency stands at 37.5% as compared to Dravid’s 39.6%.
Result: Pujara < Dravid (3-4)
Overall Performance and Conclusion:
Talking about the overall performance, Pujara may have played around 13 years as compared to Dravid’s 16, but has 50% fewer runs than Dravid. While Pujara has scored 7195 runs from 176 innings at an average of 43.6, Dravid has scored 13288 runs from 286 innings at an average of 52.3.
So, as you can see, Dravid does have better overall stats, but it is the performance in SEN countries combined that makes Dravid a far better player than Pujara. It would be interesting to see if Dravid, who is the coach of the Indian team persists with Pujara for another WTC Cycle, or finally gives up on him.
Thanks for reading! What are your thoughts on Cheteshwar Pujara vs Rahul Dravid stats comparison? Please email me your comments on business@cric8fanatic.com
ALSO READ: Suryakumar Yadav vs KL Rahul T20I Stats Comparison – Who is better?


One thought on “Cheteshwar Pujara vs Rahul Dravid – Who is a better Test Batter?”
Comments are closed.